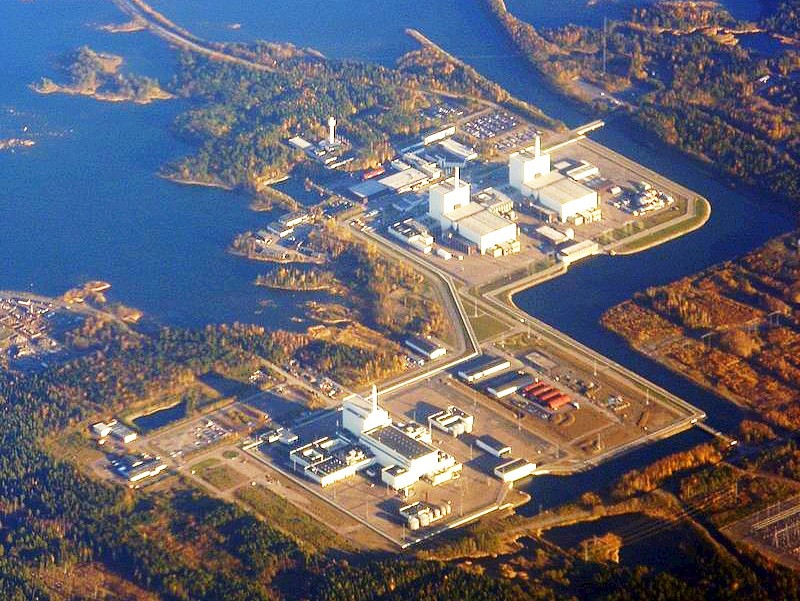
At midnight between Friday 13 and Saturday 14 November, the Forsmark 3 nuclear reactor in Sweden was shut down after a short circuit in its cabling. That left four of the country’s six reactors offline. Our Continuous scan function let us follow how the grid frequency behaved in the half-hour around the shutdown, measured by a meter at local distribution grid level.
What the data shows
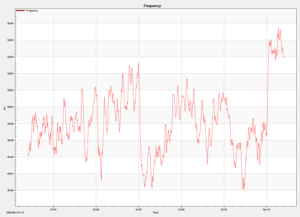
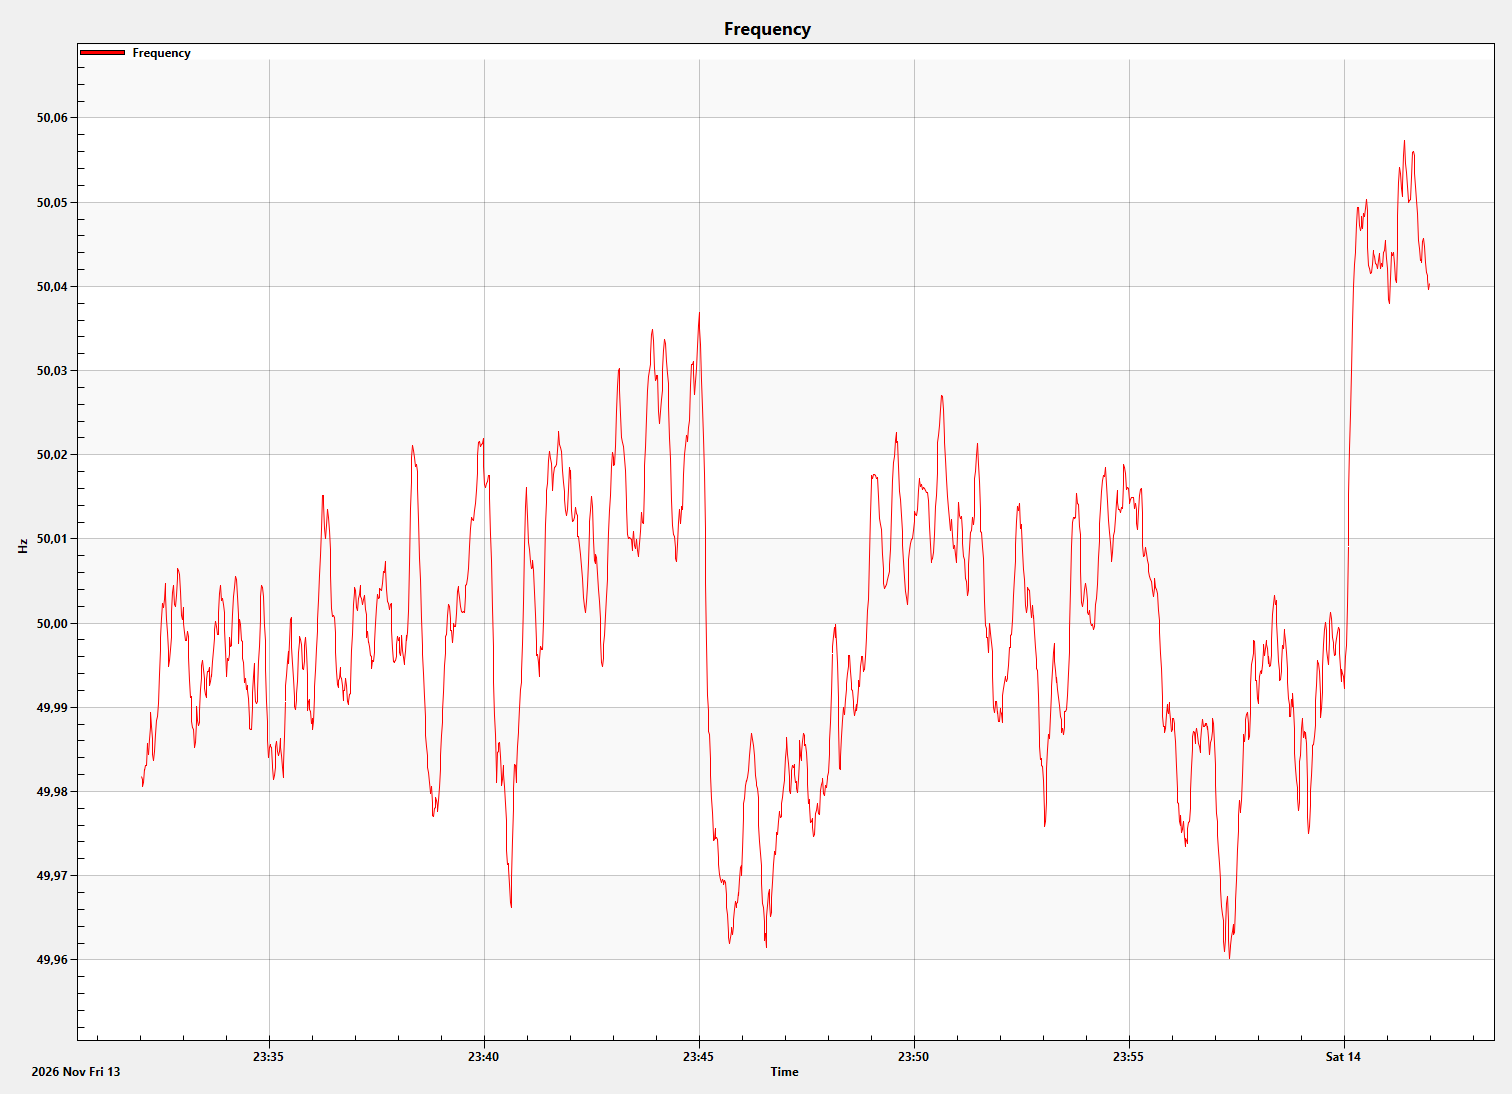
Between 23:32 and 00:02, the frequency varies between about 49.96 and 50.06 Hz. That is well inside the normal operating band of 49.90–50.10 Hz. Two events stand out:
- At 23:45, the frequency drops from about 50.04 to 49.96 Hz in under a minute, then recovers over the next few minutes.
- At 00:00, the frequency rises quickly to about 50.05 Hz and stays at that higher level.
Both events happen exactly on quarter-hour boundaries. This is a well-known pattern in the Nordic power system, where generation and consumption are scheduled in 15-minute intervals. The measurement shows that one of Sweden’s largest reactors was taken offline without any visible disturbance to the frequency, because the system had time to plan for the loss.
Why Continuous scan matters
Continuous scan records the grid all the time, not only when a threshold is exceeded. That means events that never trigger an alarm are still stored and can be analysed later, from quarter-hour shifts and control actions to major events in the power system. Frequency is shared across the whole Nordic synchronous area, so a meter in the local grid reflects what is happening in the entire system.